Ola! In this activity, we performed binary operations to identify simulated normal cells and discriminate cancer cells from normal cells. We implemented our knowledge of morphological operations to achieve our goal.
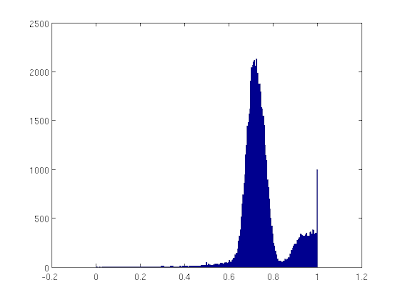
We performed the method of classifying the normal cell area by first taking patches of 256x256 pixels from the original image. This process was implemented by randomly taking a point from the original image and acquire the patch starting at that point, this way, the bias was reduced. Samples from the randomly chosen patches are shown in Fig. 1 along with the binarized version with the threshold equal 0.84.
 |
| Figure 1: Sample of the 256x256 patches from the original image and their corresponding binarized versions. |
The binarized version was done by choosing a threshold based from the pixel value histogram as shown in Fig. 2,
 |
| Figure 2: Pixel value histogram of a sample patch indicating that the threshold is near the value of 0.85. |
After generating the binarized patches, we identified the distribution of area of contiguous regions using the function bwlabel(). The histogram of the contiguous regions from the entire subimages are shown in Fig. 3. It must be noted that we limited the reasonable area to be counted in the histogram in the range 50px to 1000px only. Values outside the specified range are assigned to be outliers.
 |
| Figure 3: Histogram of the area of contiguous regions in the patches. |
In Fig. 3, we observed that the most probable area is about 500px. Thus we conclude that a normal cell has a mean area of 500px.
Now, we find a method to identify a cancer cell in a region with normal cells. We utilized the computed area of a normal cell and used it in the discrimination method. We know that when a region of smaller area is applied with the open morphological operation with a structuring element with a larger area, the region will vanish. Since the the cancer cells are relatively larger, it is possible to remove the normal cells by opening the image with the structuring element with area equal to the normal cell.
After applying the method, we have successfully determined the cancer cells from the rest of the normal cells as shown in Fig. 4.
 |
| Figure 5: Image of normal cells with randomly located cancer cells. Also shown are the detected cancer cells. |
In this activity I developed a better grasp of the concept of morphological operations and I learned that extensive applications may be adapted using the basic morphological operations in binarized images. I'll be rating myself 10/10 because I completed all the requirements for this activity and also because of the knowledge I gained.
Source:
Activity Sheet for Activity 10 - Dr. Maricor Soriano
Thanks to BA Racoma for giving me a tip regarding the open operation. :D
No comments:
Post a Comment